-
Release Notes
- July 8, 2024
- May 22, 2024
- April 17, 2024
- March 20, 2024
- February 22, 2024
- January 18, 2024
- 2023 Releases
- 2022 Releases
-
2021 Releases
- December 20, 2021
- December 1, 2021
- November 22, 2021
- November 4, 2021
- October 26, 2021
- September 30, 2021
- September 22, 2021
- September 2, 2021
- August 16, 2021
- August 2, 2021
- July 19, 2021
- July 1, 2021
- June 17, 2021
- June 1, 2021
- April 30, 2021
- April 8, 2021
- March 25, 2021
- March 15, 2021
- February 25, 2021
- February 8, 2021
- January 28, 2021
- January 21, 2021
- January 13, 2021
- 2020 Releases
- Getting Started
- Ports
- Cross Connects
- Point-to-Point
- Virtual Circuits
- Cloud Connections
- Cloud Router
- Marketplace & IX
- Administration
- Billing
- Troubleshooting & FAQ
- Technical Reference
- Partners Portal
- API & Automation
Port Details
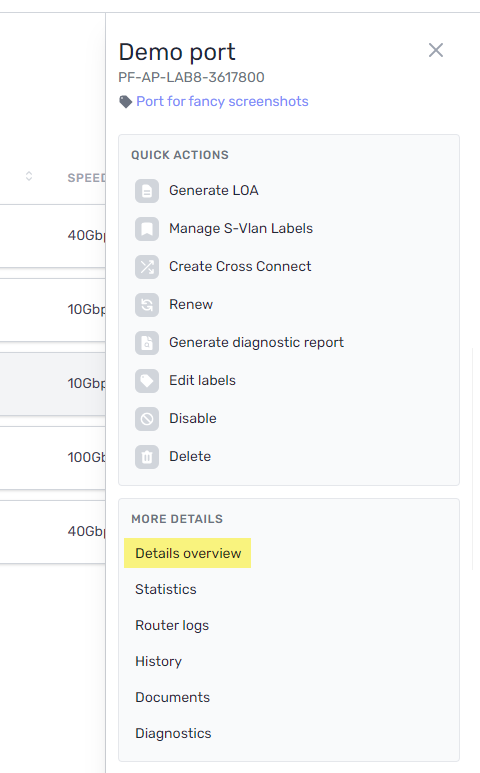
To view an overview of port details, select Ports in the menu on the left. Click the port to open a side panel with basic information.
To view complete details, select Details overview.
Details
PacketFabric status
The PacketFabric status can have the following values:
-
Active
-
Deleted
-
Disabled
-
Provisioning
On rare occasions, you might order a port at a location in which there is a temporary lack of pre-configured ports. When this happens, your port remains in the Provisioning state for 1-3 business days as we manually complete its configuration. An informational message should appear in the portal as you create the port letting you know about any lead times before you proceed.
- Row
- Field
- Description
- Row
-
Status
-
Charges begin to accrue 24 hours after you create a port (allowing you to cancel your order without incurring costs). Billing begins 15 days after the port is created or becomes operational, depending on what happens first. See Port Terms and Billing.
This field tells you how many days you have until billing begins. After billing begins, this field tells you when billing started.
-
- Row
- Rate
- The monthly rate for the port.
- Row
- Term
- The contract length for the port.
Administrative status
The administrative status refers to whether the router is enabled (Up) or disabled (Down).
- Row
- Field
- Description
- Row
- Time Created
- Date and time the port was provisioned.
- Row
- Time Updated
- Date and time the port information was last modified.
- Row
- Last Flap
- This indicates the last recorded route flap. Route flapping can be caused by a variety of hardware, software, and connection errors.
Operational status
The operational status is read from your router and refers to the state of your cross connect.
This section also provides information about the data center in which the port is located.
In some cases, the data center information might be different between the customer and PacketFabric (for example, different sites on a shared campus).
Device and media
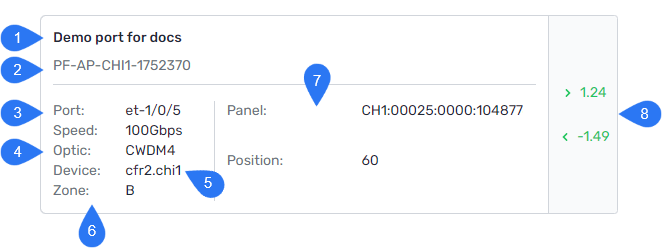
1
The device description. You can change this by editing the port.
2
This is the circuit ID.
- PF-AP identifies it as a port
- Followed by the POP name
- Followed by a unique numerical ID
For a list of all PacketFabric ID abbreviations, see Acronyms and Terms.
3
This is the interface name.
Each interface name follows a different format depending on the manufacturer.
The interface name has the following format: type unit#/slot#/subslot#/port#.
The type can be one of the following:
gi: Gigabit Ethernet interfacete: 10 Gigabit Ethernet interfacetw: 25 Gigabit Ethernet interfacefo: 40 Gigabit Ethernet interfacehu: 100 Gigabit Ethernet interface
For more information, see Cisco - Interface Naming Overview.
The interface name has the following format: type-fpc/pic/port.
The type can be one of the following
ae: Aggregated Ethernet interfacege: Gigabit Ethernet interfacexe: 10 gigabit Ethernet interfaceet: 100 and 40 Gigabit Ethernet interface
For more information, see Juniper - Interface Naming Overview.
4
This is the optic. For more information about our optics, see Optic Specifications.
5
This is the device name. It has the following format: <router type><number>.<POP ID>.
The router type is one of the following:
- CFR
- Core Fabric Router.
- These routers are large and can support many 40 Gbps and 100 Gbps connections. Our CFR hardware is either the Juniper QFX10k series or Cisco NCS5500 series.
- EFR
- Edge Fabric Router.
- These routers are usually smaller. If the POP already has a CFR setup, the EFR typically handles the 1 Gbps connections. At smaller sites, EFR can support a limited number of 100 Gbps connections.
For more information about device hardware, such as make and model, use the Device-Info API call.
6
This is the availability zone.
The availability zone signifies device diversity. Provisioning connections across availability zones builds redundancy in your network.
7
Where the connection is located on the PacketFabric equipment. This information is formatted differently depending on the site and hardware used.
8
These are the optical light levels.
Optical light levels are measured in terms of transmitted power (TX) and received power (RX).
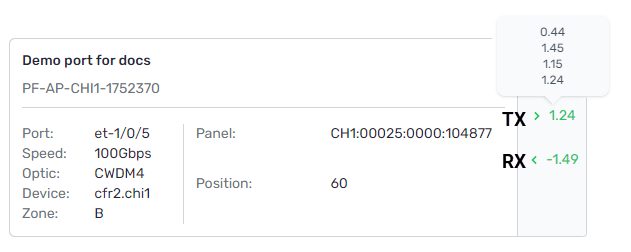
When working correctly, the optical signal strength should fall within a certain power range.
-
A green arrow next to the RX/TX value indicates a healthy connection.
-
An orange arrow indicates that the optic levels are in the “warning” range.
-
A red arrow indicates that the optic levels are in the “alarm” range.
-
Gray arrows indicate that the cross connect has not been installed yet.
NOTES:
-
The acceptable range is different depending on the optics. For more information, see Optic Specifications.
-
There is approximately a 30-60 second lag between optical light events and when they appear in the portal or through the API.
Optical power that is too high can saturate the receiver and prevent a clean decode, resulting in errors. This is typically caused by the wrong type of optic, a too-short fiber span, or an active device in the path (such as an amplifier or DWDM transponder).
Optical power that is too low can result in slow connections, connections that won’t pass data, and connections that might not link at all. This is typically caused by unseated or dirty patches, a bad cross connection, or a longer fiber span than expected.
If your optical light levels are consistently too low, you can have the patches cleaned, scoped, and replaced as needed.
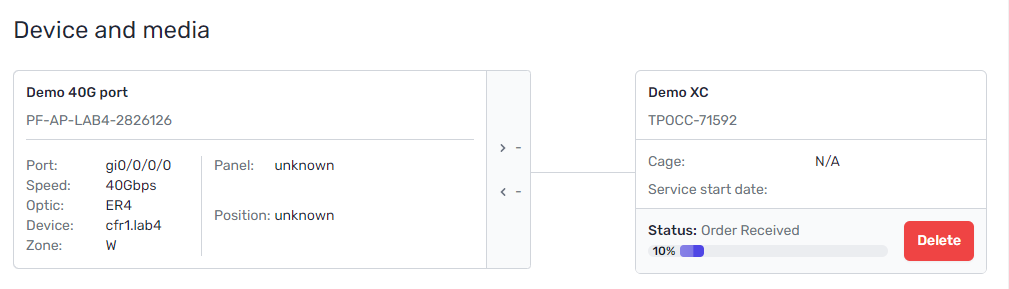
Cross connect
If you order an outbound cross connect through PacketFabric, you can track its installation progress.
- Row
- Status
- Description
- Order Received
- Order Received
- We have received the cross connect order.
- Order Review
- Order Review
- We are evaluating the order to ensure that we have all the required information.
- Pending Approval
- Pending Approval
- We have submitted a request to the data center and are waiting for a response.
- Order Accepted
- Order Accepted
- The order has been accepted and the cross connect is being installed.
- Completed
- Cross Connect Completed
- The cross connect has been installed.
- QA Testing
- QA Testing
- The cross connect has been installed and we are ensuring everything is working correctly.
- Completed
- Complete/Closed
- The cross connect has been installed, tested, and is ready to use.
- Pending Information
- Hold/Pending Information
- We need more information from you or from the data center.
- Canceled
- Canceled
- The order has been canceled.
Click Delete to remove the cross connect. For example, if you are moving how or where you are connecting to us, upgrading equipment, or if the connection is faulty.
For more information, see Cross Connects.
Active Cloud Router Connections
The Active Cloud Router Connections table lists all the Cloud Router connections attached to the port. You cannot delete a port if it has connections associated with it.
Note that only active Cloud Router connections are listed here. For example, if the connection does not have BGP configured yet, then it is not yet active and is not displayed.
Active Virtual Circuits
The Active Virtual Circuits table lists all the virtual circuits attached to the port. You cannot delete a port if it has virtual circuits associated with it.
Click the View icon to go to the details page for that circuit.
Disabled cross connects
This table lists any previously disconnected cross connects.
This only applies to outbound cross connects ordered through PacketFabric.
Statistics
The statistics page presents graphical information on traffic, errors, and optics.
By default, you are shown metrics over the past 12 hours. You can use the drop-down menus to select a different time frame, or select Custom to specify a date and time range.
Traffic metrics
You can view the following traffic metrics. Hover to see TX and RX details.
- Header Row
- Metric
- Description
- Row 1
- Bits per second
- How many bits of data were transmitted per second.
- Row 2
- Packets per second
- Total number of packets per second.
- Row 3
- Unicast Packets
- Unicast packets are sent from a single source to a single receiver. Most LAN and internet traffic is unicast packets. This includes TCP traffic.
- Row 4
- Broadcast Packets
- Broadcast packets are sent from a single source to all receivers on the connection. This includes ARP traffic.
- Row 5
- Multicast Packets
- Multicast packets are sent from one or more sources to one or more receivers. This includes UDP traffic.
Error metrics
-
Header Row
- Metric
- Description
-
Row 1
-
Framing Errors
-
Framing errors occur when a data frame is read at the wrong starting point or is not in the format expected.
Common causes include hardware issues (optic cables, serial ports, NIC), duplex mismatches, and mismatched settings between the serial port and device.
-
-
Row 2
- Resource Errors
- The number of transmit drops. This typically indicates a buffer error or that packets are too large to add to the buffer.
-
Row 3
- MTU Errors
- The number of packets whose size exceeded the interface MTU. This is an output error.
-
Row 4
- CRC Errors
- CRC errors indicate data corruption. These can be caused by a faulty cable, PIC, or FPC.
-
Row 5
- Drops
- The number of packets ASIC’s RED mechanism drops from the input queue. This can indicate traffic congestion or inadequate buffer size.
-
Row 6
- Discards
- The number of discarded packets over the burst allowance (your committed rate). Our default burst size is 6250000 bytes.
-
Row 7
- Runts
- The number of frames that have been received and are smaller than the minimum frame size (64 bytes). These are typically caused by collisions
-
Row 8
- Aged
- The number of packets that spent so much time in memory that they have been automatically purged. This can indicate software and hardware malfunctions.
Optic metrics
-
Header Row
- Metric
- Description
-
Row 1
- Module Temperature
- We use commercial transceivers, which have a temperature range of approximately 0-70° C.
-
Row 2
- Transmit and Receive Power
- Transceiver power over time.
Router logs
The information that is logged varies depending on the device. Common log messages are SNMP_TRAP_LINK_UP and SNMP_TRAP_LINK_DOWN, which are logged when an interface changes state.
Any optical light level warnings or alarms are also logged here.
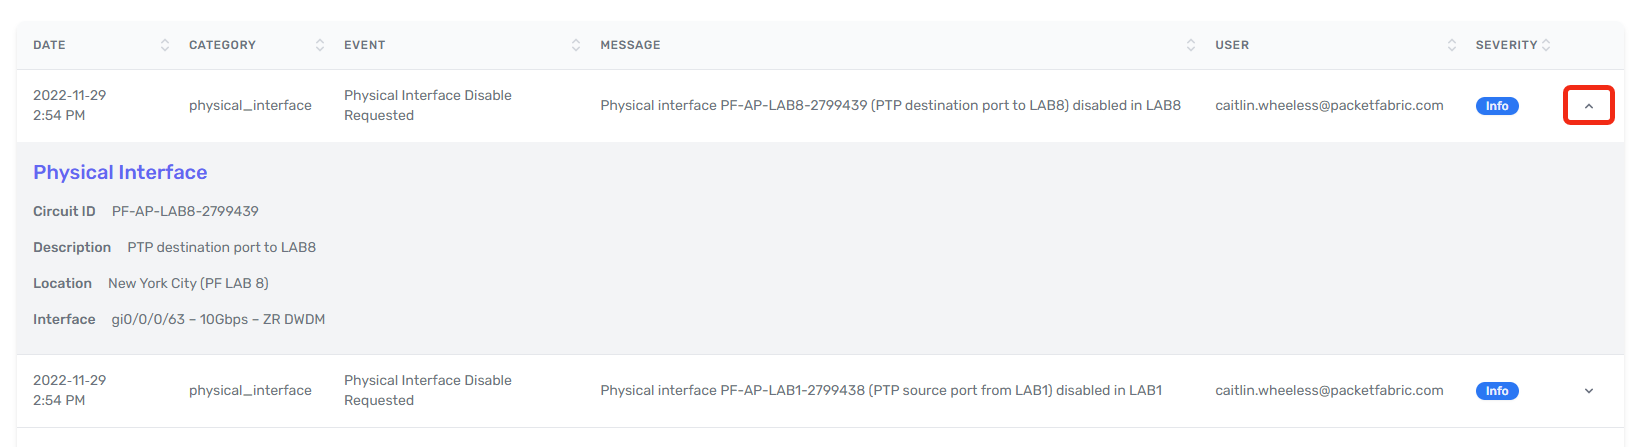
History
The History page shows event logs specific to the interface.
Events that are logged include the following:
- When the interface was created
- Disable and enable actions
- Any changes to the port name
Click Toggle Details to view more information about the event.
Documents
From here you can find and download the LOA and any service orders.
Related APIs
Updated on 02 Mar 2026