-
Release Notes
- July 8, 2024
- May 22, 2024
- April 17, 2024
- March 20, 2024
- February 22, 2024
- January 18, 2024
- 2023 Releases
- 2022 Releases
-
2021 Releases
- December 20, 2021
- December 1, 2021
- November 22, 2021
- November 4, 2021
- October 26, 2021
- September 30, 2021
- September 22, 2021
- September 2, 2021
- August 16, 2021
- August 2, 2021
- July 19, 2021
- July 1, 2021
- June 17, 2021
- June 1, 2021
- April 30, 2021
- April 8, 2021
- March 25, 2021
- March 15, 2021
- February 25, 2021
- February 8, 2021
- January 28, 2021
- January 21, 2021
- January 13, 2021
- 2020 Releases
- Getting Started
- Ports
- Cross Connects
- Point-to-Point
- Virtual Circuits
- Cloud Connections
- Cloud Router
- Marketplace & IX
- Administration
- Billing
- Troubleshooting & FAQ
- Technical Reference
- Partners Portal
- API & Automation
Longhaul Usage Pages
When you create a virtual circuit, you have the option to select usage-based billing ($0.02/GB).
To view information about your usage and better understand your costs, log in to the PacketFabric portal and select Billing in the top menu.
Note: Not all users have access to the Billing page.
The following pages only display information about virtual circuits with usage-based billing. If all your circuits are on dedicated plans, the bar graphs are blank.
Statistics and costs
Historic view
Longhaul Usage Statistics displays your longhaul usage for the past 12 months:
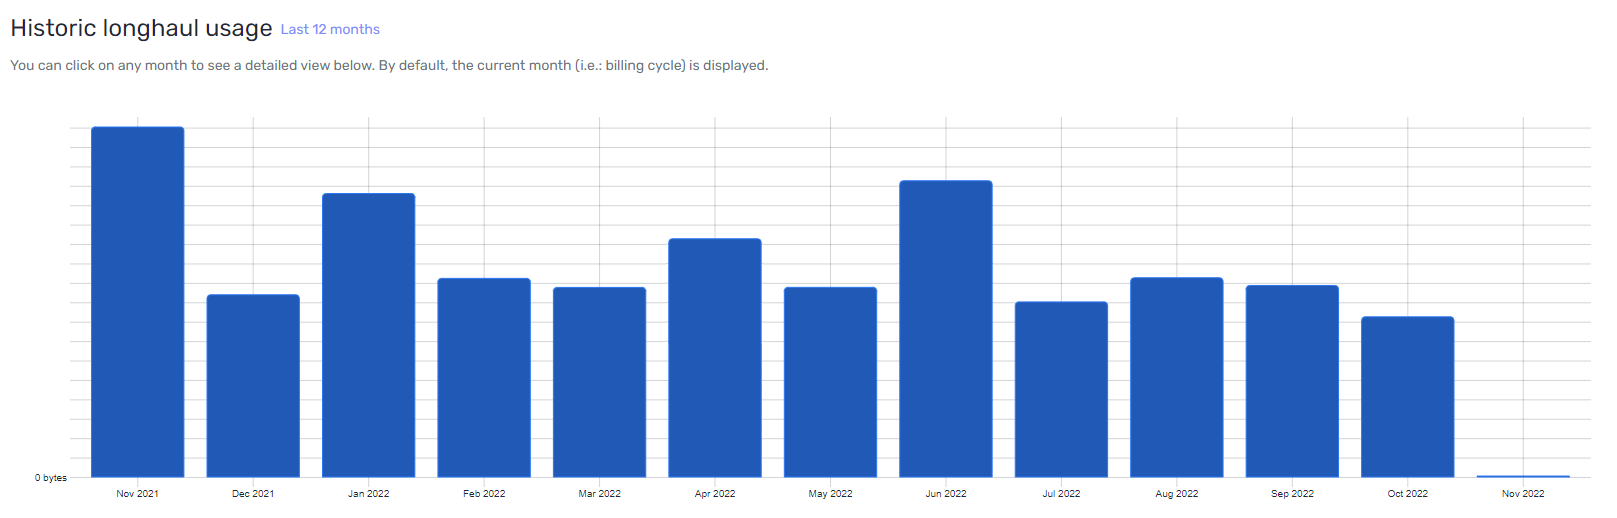
From here you can do the following:
- Hover over a month to view the GB used.
- Click a month to view daily usage information.
Daily view
The daily view displays daily usage for the current month. To see the daily usage for a previous month, click the month above under Longhaul Usage Statistics.
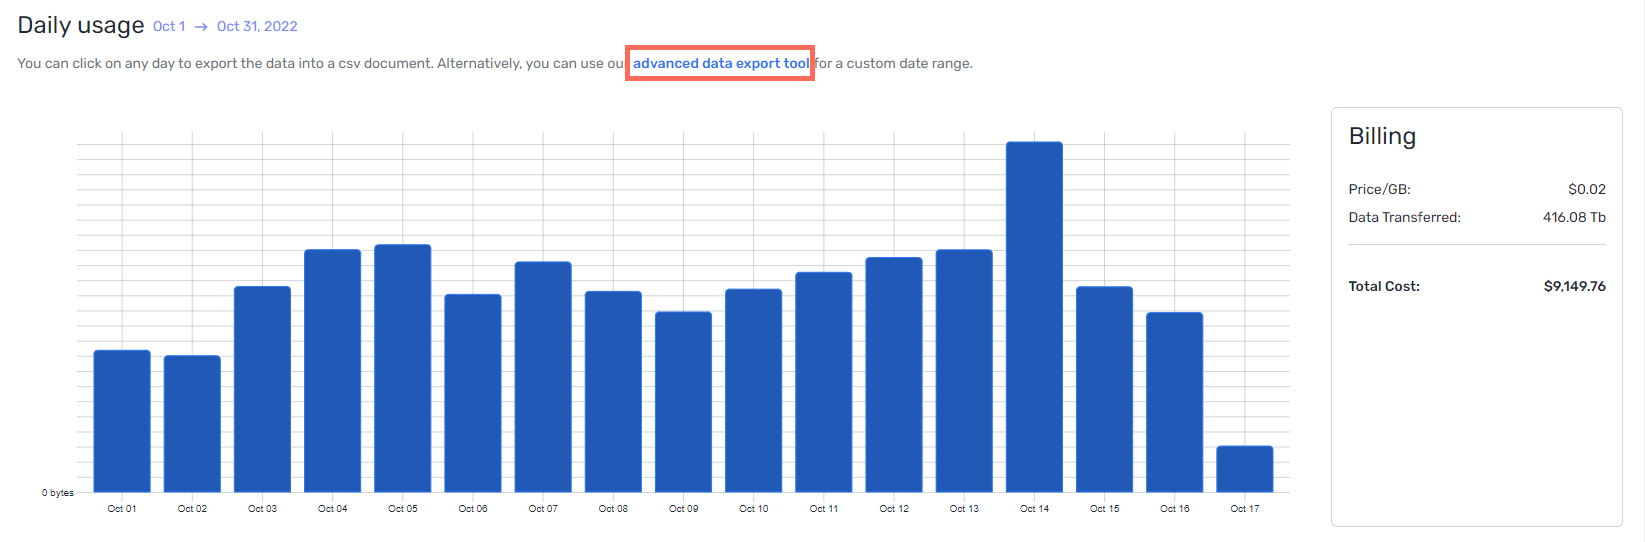
From here you can do the following:
-
Hover over a day to view the MB used.
-
Click a day to download a CSV file with traffic information for that day separated by virtual circuit.
-
Click Advanced Data Export Tool to open a new window. From here you can specify a date range for which to download a CSV file with traffic information by virtual circuit.
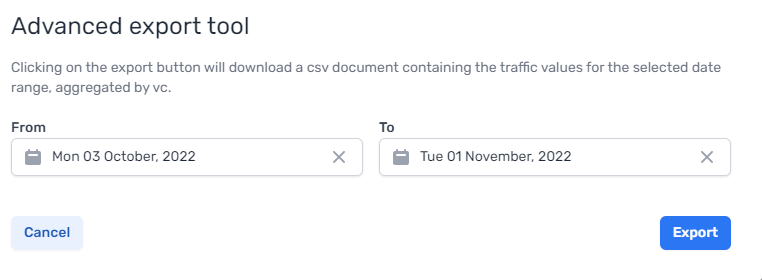 TIP: Click the calendar icon and use your up/down arrow keys to navigate to past or future months. You can also manually enter dates in the date fields (MM/DD/YYYY).
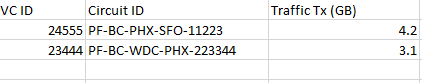
When you export traffic data, you download a CSV file with the following information:
-
Virtual circuit ID
-
Circuit ID
-
Traffic transmitted in GB
By virtual circuit
Table view
This table displays traffic by virtual circuit. By default, data for the last year is displayed. Use the date fields above to adjust the date range you would like to view:
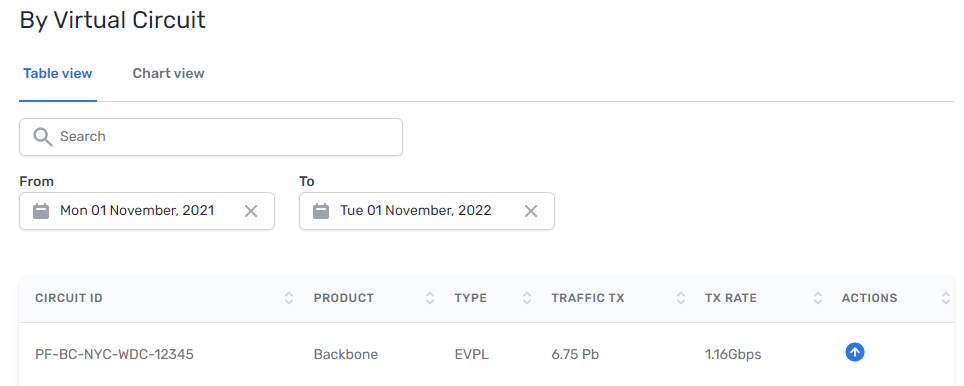
From here you can do the following:
-
Click Upgrade to under the Actions column to upgrade to a dedicated connection.
-
Click Export to CSV at the bottom of the page to download a CSV file with the following information (taken from the date range specified):
- Virtual circuit ID
- Circuit ID
- Product (marketplace, IX, or backbone connection)
- Type (EVPL)
- Traffic transmitted
- Transmit rate
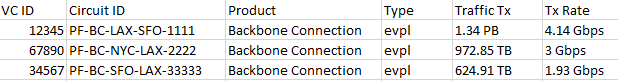
Chart view
The pie chart displays traffic over the last 12 months by virtual circuit.
Related links
Updated on 01 Nov 2022