Point-to-Point Connection Details Pages
To view the connection details, select Point to Points in the menu on the left. Click one of the table rows to view an overview of that connection. For complete information, click Details.
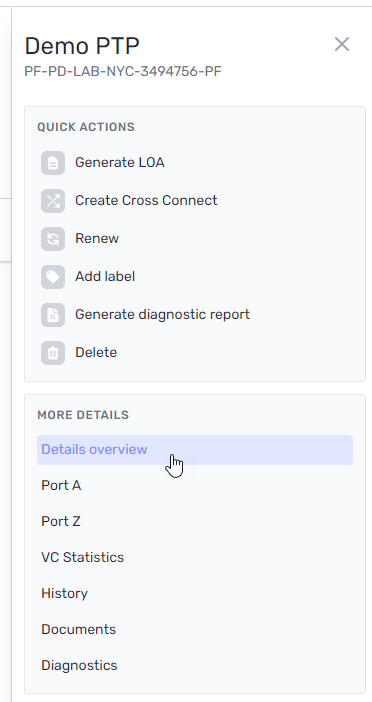
For information about the Details page, see Point-to-Point Connection Details .
Because a point-to-point connection is essentially two ports connected by a single virtual connection, the details page comprises a combination of the same information you would find on a port details page and virtual circuit details page .
Port A and Port Z
The Port A and Port Z pages provide details about the two ports in the point-to-point connection.
- Header Row
- Col1
- Col2
- r
- Admin
- The administrative status refers to whether the router is enabled (Up) or disabled (Down).
- r
- Port ID
- A unique identifier for the source port that includes the metro in which the port is located.
- r
- Speed/Media
- The speed and optic you selected when creating the connection. For more information, see LINK> The speed and optic values are the same between the source and destination ports.
- r
-
Device Name
-
The device name has the following format:
<router type><number>.<POP ID>.The router type is one of the following:
- CFR: Core Fabric Router
These routers are large and can support many 40 Gbps and 100 Gbps connections. Our CFR hardware is either Juniper QFX10k series or Cisco NCS5500 series. - EFR: Edge Fabric Router
These routers are usually smaller. If the POP already has a CFR setup, the EFR typically handles the 1 Gbps connections. At smaller sites, EFR can support a limited number of 100 Gbps connections.
For more information about device hardware, such as make and model, use the Device-Info API call .
- CFR: Core Fabric Router
-
- r
-
Interface
-
The interface name has the following format:
type-fpc/pic/port.Type
xe: 10 gigabit Ethernet interfaceet: 100 and 40 Gigabit Ethernet interfacege: Gigabit Ethernet interfaceae: Aggregated Ethernet interface
FPC: The slot number in which the FPC (flexible PIC concentrator) or DPC (dense port concentrator) line card is installed.
PIC: The PIC (physical interface card) location number on the FPC.
Port: The port number on the PIC or DPC.
For more information, see Juniper - Interface Naming Overview .
-
- r
- Operational
- The Operational status is read from your router and refers to the state of your cross connect link.
- r
- Panel
Position - Information about where the connection is place in the data center. How this information is formatted varies depending on the site and hardware used.
- Panel
- r
- Availability Zone
- The availability zone signifies device diversity. Provisioning connections across availability zones builds redundancy in your network.
- r
-
Autonegotiation
(1G connections only) -
Autonegotiation is enabled by default. You can toggle it off for troubleshooting purposes or if you are connecting to a device operating in full-duplex mode.
You can also toggle this on or off when editing the connection .
NOTE: While autonegotiation is togglable on 1Gbps interfaces, it is also enabled on all 10Gbps and larger interfaces.
-
- r
- Last Flap
- This indicates the last recorded route flap. Route flapping can be caused by a variety of hardware, software, and connection errors.
- r
- Trend
- Graphical representation of network traffic over the last 24 hours.
- r
-
PacketFabric Location
Customer Location -
Information about the data center in which the port is located.
In some cases, the data center information might be different between the customer and PacketFabric (for example, different sites on a shared campus).
-
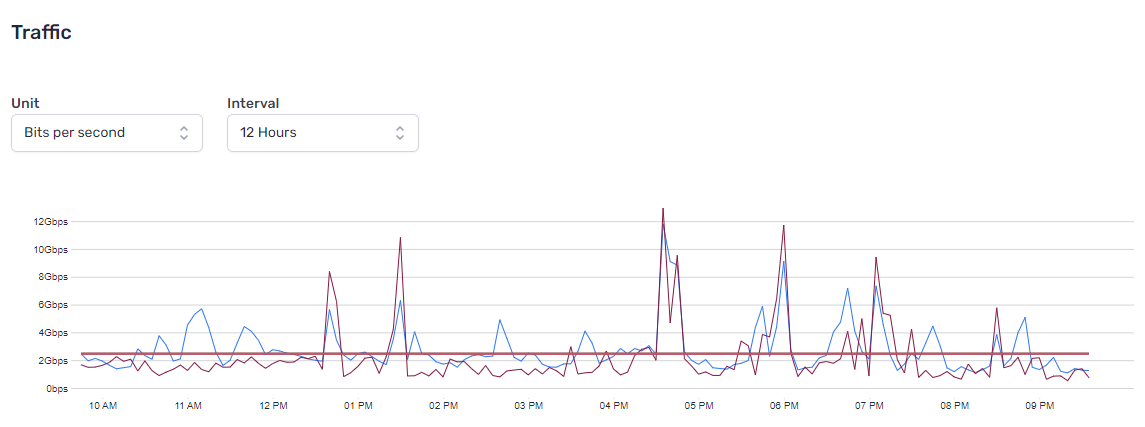
As you scroll down the page, you will see graphical information on traffic, errors, and optics for the ports.
By default, you are shown metrics over the past 12 hours. You can use the drop-down menus to select a different time frame, or select Custom to specify a date and time range.
Traffic metrics
Error metrics
Optic metrics
VC Statistics
The statistics page presents a graphical view of the network traffic for the EPL connecting the to ports.
By default, you are shown metrics over the past hour. You can use the drop-down menus to select a different time frame, or select Enter Date Range to specify a date and time range.
You can view traffic in bits per second or packets per second.
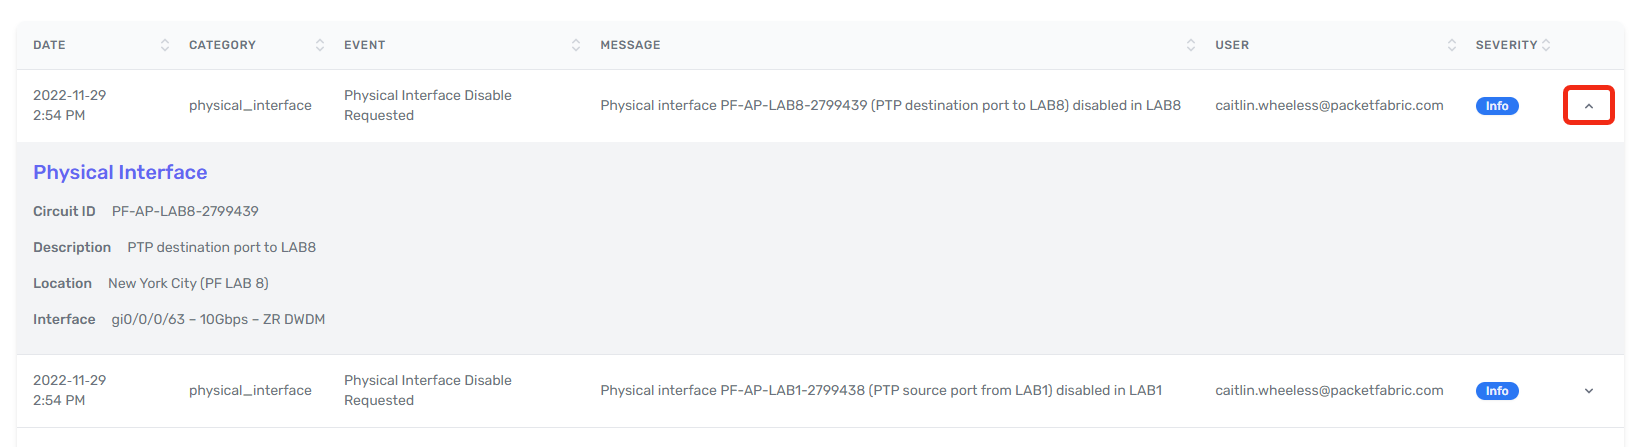
History
The History page shows event logs specific to the connection.
Events that are logged include the following:
- When the interfaces were created
- LOA generation
- Any changes to the connection name
Click Toggle Details to view more information about the event.
Documents
From here you can find and download the LOA and any service orders.